
UK construction needs an average of 41,200 extra recruits a year between 2026 and 2030, according to CITB. Yet the latest official vacancy count has fallen to 27,000. These figures describe different things: the people the industry needs to recruit over time, and the jobs employers are actively trying to fill now. Together with employer surveys and training data, they show why a quieter jobs market can still have serious skills shortages. CITB forecast [1]; ONS vacancy data [2].
Updated . Figures below retain their original geography and reporting period.
On this page
- About these figures
- UK construction skills shortage: key statistics
- What does “construction skills shortage” actually measure?
- How many construction vacancies are there in the UK?
- How often do employers struggle to find skilled workers?
- How many extra construction workers are needed by 2030?
- Which construction occupations need more recruits?
- Where is the recruitment need greatest?
- Why do some forecasts say construction needs more than one million workers?
- Are enough people entering construction apprenticeships?
- What the figures mean for site management and training
- Frequently asked questions
- Sources and methodology
- Download the data
- Sources
UK construction skills shortage: key statistics
- 206,000 extra recruits over five years: CITB’s annual requirement of 41,200 across 2026–2030. This is a forecast recruitment requirement, not today’s unfilled jobs.[1]
- 27,000 construction vacancies: the provisional UK average for July–September 2026, seasonally adjusted.[2]
- 45% of construction vacancies were skill-shortage vacancies in the UK Employer Skills Survey 2024, compared with 27% across all sectors. Employer Skills Survey [3].
- 68% of surveyed small building firms were affected by a lack of skilled tradespeople in January–June 2026. FMB/CIOB survey [4].
- 23,900 apprenticeship starts in Construction, Planning and the Built Environment in England during August 2025–April 2026, up 5% on the equivalent period a year earlier. DfE apprenticeship statistics [5].
What does “construction skills shortage” actually measure?
There is no single figure that captures every missing construction skill. A vacancy count measures active recruitment. A skills survey asks whether suitable applicants are available. A workforce forecast estimates what recruitment will be needed under a set of assumptions. Keeping those measures separate makes the statistics much more useful.
| Measure | Question it helps answer | What it does not establish |
|---|---|---|
| Current vacancies | How many unfilled posts are employers recruiting for? | Whether every post is difficult to fill because of skills. |
| Skill-shortage vacancies | Which vacancies are difficult to fill because applicants lack the required skills, qualifications or experience? | The number of workers needed over the next decade. |
| Skills gaps within the workforce | Where do existing employees need to develop their proficiency? | How many additional employees a business needs. |
| Forecast recruitment requirement | How much extra recruitment may be needed to sustain and expand the workforce? | The number of jobs available to applicants today. |
The survey definitions distinguish recruitment difficulties from shortcomings within an existing team. For employers, that distinction points towards different responses: recruitment, retention, development or a combination. Employer Skills Survey definitions [3].
How many construction vacancies are there in the UK?
ONS recorded 27,000 construction vacancies in July–September 2026, down 7,000, or 20.5%, from April–June. This is the latest release available at our review date; the next bulletin was scheduled for 17 November 2026. ONS, October 2026 bulletin [2].
Scroll horizontally to view the full chart on a small screen.
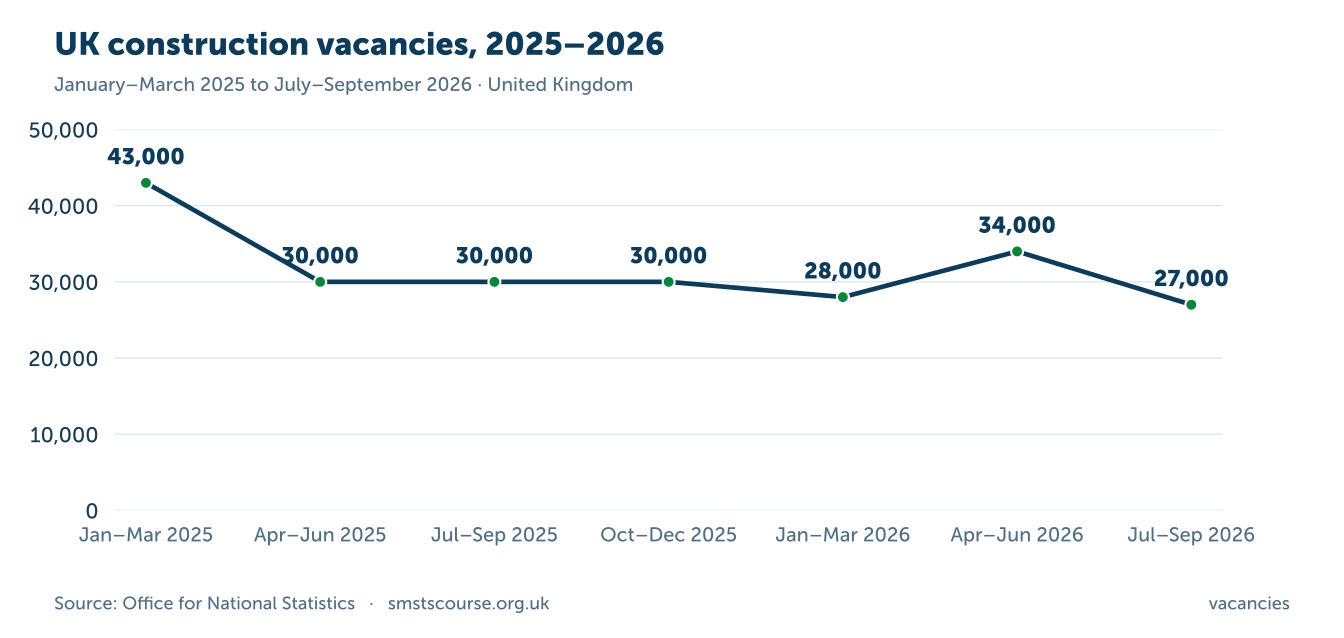
Seasonally adjusted three-month averages; non-overlapping periods. July–September 2026 is provisional.
View the figures behind this chart
| Period | Vacancies |
|---|---|
| January–March 2025 | 43,000 |
| April–June 2025 | 30,000 |
| July–September 2025 | 30,000 |
| October–December 2025 | 30,000 |
| January–March 2026 | 28,000 |
| April–June 2026 | 34,000 |
| July–September 2026 | 27,000 |
Source: ONS VACS02, October 2026, construction series JP9L [2]. Seasonally adjusted three-month averages, rounded to the nearest thousand; the latest period is provisional.
Falling vacancies do not, by themselves, show that every employer can find the people they need. A business can postpone hiring because its order book is weak while still struggling to recruit a particular trade when work arrives. Conversely, more vacancies do not automatically mean a larger skills deficit: recruitment can increase when businesses expand.
For workforce planning, the practical question is narrower than “is construction hiring?” It is whether the right people will be available for a particular role, location and project date.
How often do employers struggle to find skilled workers?
In the UK Employer Skills Survey 2024, 45% of construction vacancies were difficult to fill because applicants lacked the necessary skills, qualifications or experience. Construction had the highest skill-shortage vacancy density of any sector. The proportion had fallen from 52% in 2022, but remained above the whole-economy figure of 27%. Employer Skills Survey 2024 [3].
| Sector | 2022 | 2024 |
|---|---|---|
| Construction | 52% | 45% |
| All sectors | 36% | 27% |
These percentages describe vacancies, not the share of construction businesses with recruitment problems. The UK survey interviewed 22,712 employers across the economy. Its 2024 results should not be multiplied by the 2026 ONS vacancy count to produce a supposed current shortage total. Survey scope and results [3].
The impact on smaller building firms
The FMB/CIOB State of Trade survey for January–June 2026, published on 10 November, received 416 responses from micro, small and medium-sized construction firms. It found that 68% were affected by a shortage of skilled tradespeople. FMB/CIOB H1 2026 results [4].
Scroll horizontally to view the full chart on a small screen.
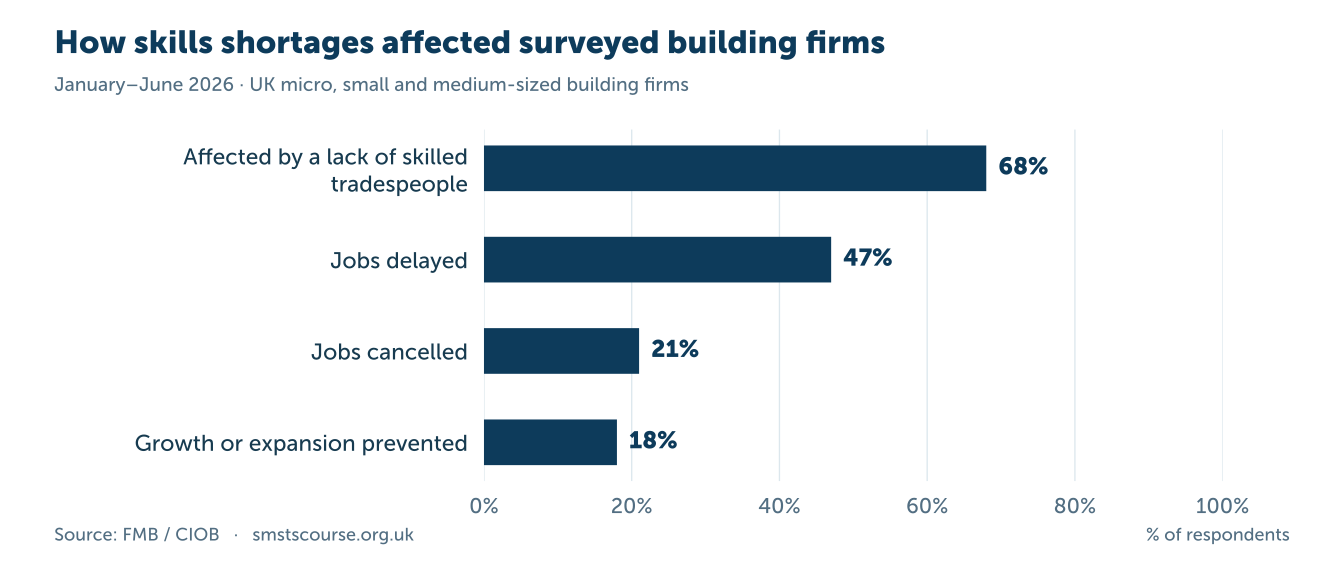
FMB/CIOB survey, 416 responses. Categories overlap and must not be added together.
View the figures behind this chart
| Effect | Share of surveyed firms |
|---|---|
| Affected by a lack of skilled tradespeople | 68% |
| Jobs delayed | 47% |
| Jobs cancelled | 21% |
| Business growth or expansion prevented | 18% |
Source: FMB/CIOB, fieldwork by Barbour ABI [4]. These responses can overlap: a firm might report both a delay and a cancelled job. The figures describe this survey’s respondents and should not be presented as an exact count of all UK contractors.
How many extra construction workers are needed by 2030?
CITB’s Construction Workforce Outlook forecasts an average requirement for 41,200 extra workers a year during 2026–2030, equivalent to around 206,000 over five years. Its workforce projection rises from 2,606,380 in 2025 to 2,681,800 in 2030. CITB Construction Workforce Outlook [1].
The difference between those workforce totals is 75,420. That is the projected net increase in the size of the workforce; it is smaller than the recruitment requirement because some recruitment replaces people leaving. CITB models movements into and out of construction, retirement and demand from growth. CITB UK report, pages 11–12 [1].
Think of a contractor that needs a larger team next year while several experienced staff leave. Hiring only the number needed for expansion would leave the business short once those departures happen. At industry level the same distinction applies, although the model also takes account of normal recruitment flows.
The forecast is an extra recruitment requirement above recent flows. It is therefore misleading to describe 206,000 as either “jobs currently unfilled” or “206,000 entirely new jobs”.
Which construction occupations need more recruits?
The requirement extends across trades, supervision and professional roles. The table shows selected occupations relevant to site delivery; it excludes CITB’s broad office and senior-management categories. CITB UK occupation table [1].
Scroll horizontally to view the full chart on a small screen.
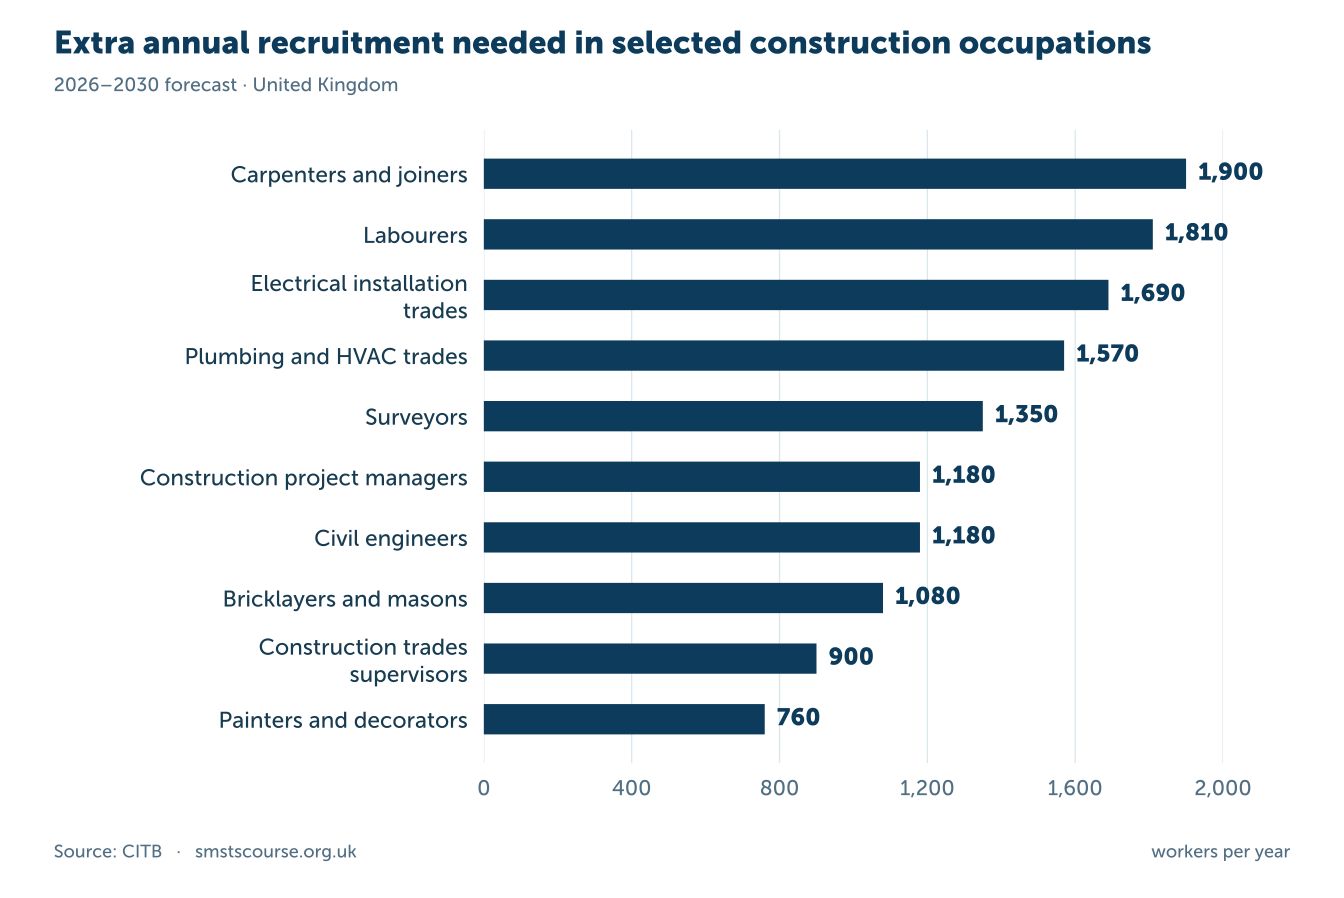
Selected site, trade and professional occupations; broad management and office categories excluded. Forecast extra recruitment above current flows, not current vacancies.
View the figures behind this chart
| Occupation | Extra workers per year | As a share of its 2025 workforce |
|---|---|---|
| Carpenters and joiners | 1,900 | 1.2% |
| Labourers | 1,810 | 1.4% |
| Electrical installation trades | 1,690 | 1.2% |
| Plumbing and HVAC trades | 1,570 | 1.2% |
| Surveyors | 1,350 | 2.0% |
| Construction project managers | 1,180 | 2.0% |
| Civil engineers | 1,180 | 2.2% |
| Bricklayers and masons | 1,080 | 1.6% |
| Construction trades supervisors | 900 | 1.9% |
| Painters and decorators | 760 | 1.1% |
| Architects | 750 | 2.0% |
| Plant operatives | 670 | 1.6% |
| Plant mechanics/fitters | 660 | 1.8% |
| Plasterers | 590 | 1.3% |
| Roofers | 550 | 1.4% |
| Scaffolders | 400 | 1.7% |
Source: CITB, UK report, page 11 [1]. Values are rounded and are forecasts, not live vacancies.
A larger number does not automatically mean a harder recruitment problem. Large occupational groups tend to need more people in absolute terms. The percentage column helps compare that demand with the size of the existing workforce. It still cannot tell an individual employer how many suitable applicants will be available locally.
Where is the recruitment need greatest?
All four UK nations need additional recruitment under CITB’s forecast. England has the largest headcount requirement; the table expresses each nation’s requirement against its own workforce so that size and relative demand can be considered separately.
| Nation | Extra workers per year | Share of 2025 workforce | Source |
|---|---|---|---|
| England | 36,340 | 1.6% | CITB England report [1] |
| Scotland | 2,590 | 1.3% | CITB Scotland report [1] |
| Wales | 1,240 | 1.1% | CITB Wales report [1] |
| Northern Ireland | 1,040 | 1.5% | CITB Northern Ireland report [1] |
These are additional workers needed above recent recruitment flows, including replacement and growth. Rounded nation totals add to 41,210; CITB publishes a UK total of 41,200. The small rounding difference is not an additional recruitment requirement.
Across the nine English regions, Greater London has the largest annual requirement at 6,780 people. The North West has the highest relative requirement, 2.0% of its 2025 workforce, followed by the North East at 1.9%. That is why a large headcount and a large proportional requirement are different findings. CITB England report [1].
Scroll horizontally to view the full chart on a small screen.
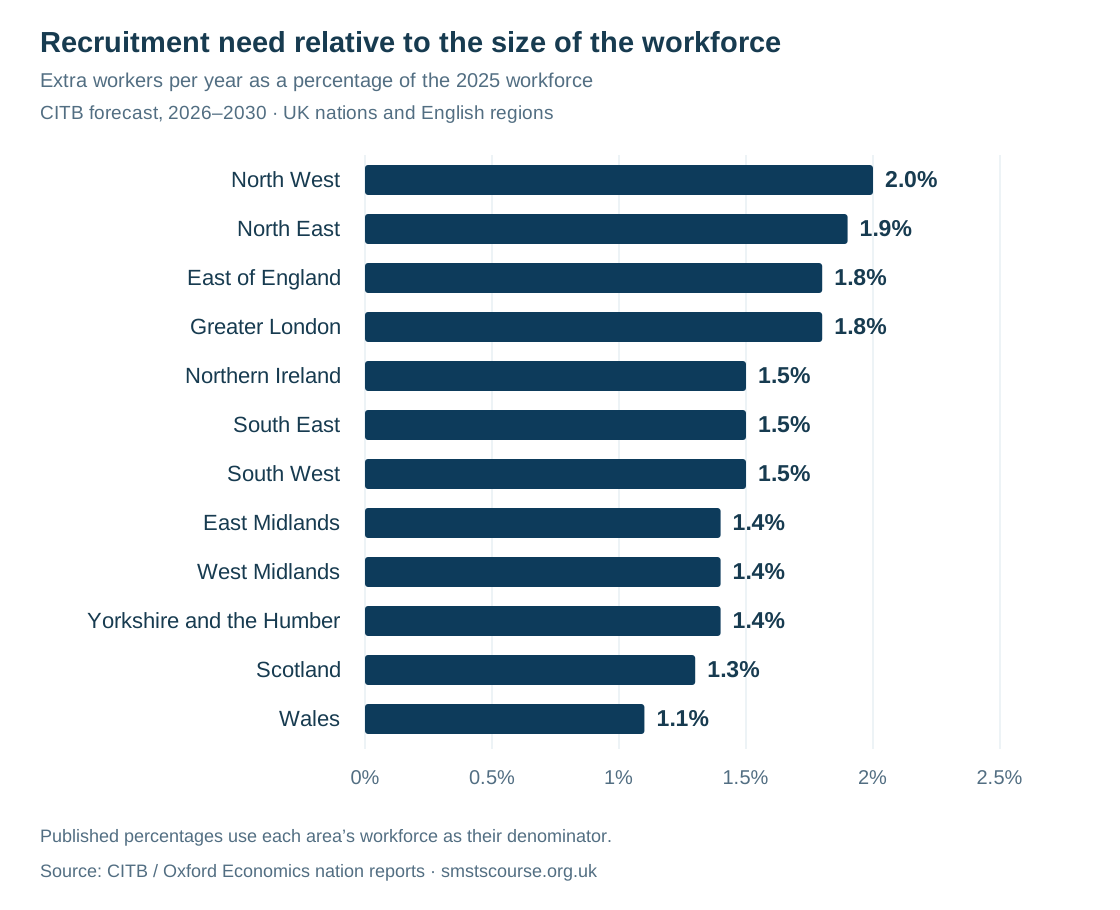
Annual extra recruitment as a share of each area’s 2025 workforce. Nine English regions and the three other UK nations are separate geographic areas. Published rounded forecasts; not current vacancies or a direct measure of hiring difficulty.
View annual numbers and percentages for all 12 areas
| Area | Extra workers per year | Share of 2025 workforce |
|---|---|---|
| North West | 4,990 | 2.0% |
| North East | 1,800 | 1.9% |
| East of England | 4,140 | 1.8% |
| Greater London | 6,780 | 1.8% |
| Northern Ireland | 1,040 | 1.5% |
| South East | 5,780 | 1.5% |
| South West | 3,650 | 1.5% |
| East Midlands | 2,550 | 1.4% |
| West Midlands | 3,810 | 1.4% |
| Yorkshire and the Humber | 2,840 | 1.4% |
| Scotland | 2,590 | 1.3% |
| Wales | 1,240 | 1.1% |
Compare the English regions by number of extra workers
Scroll horizontally to view the full chart on a small screen.
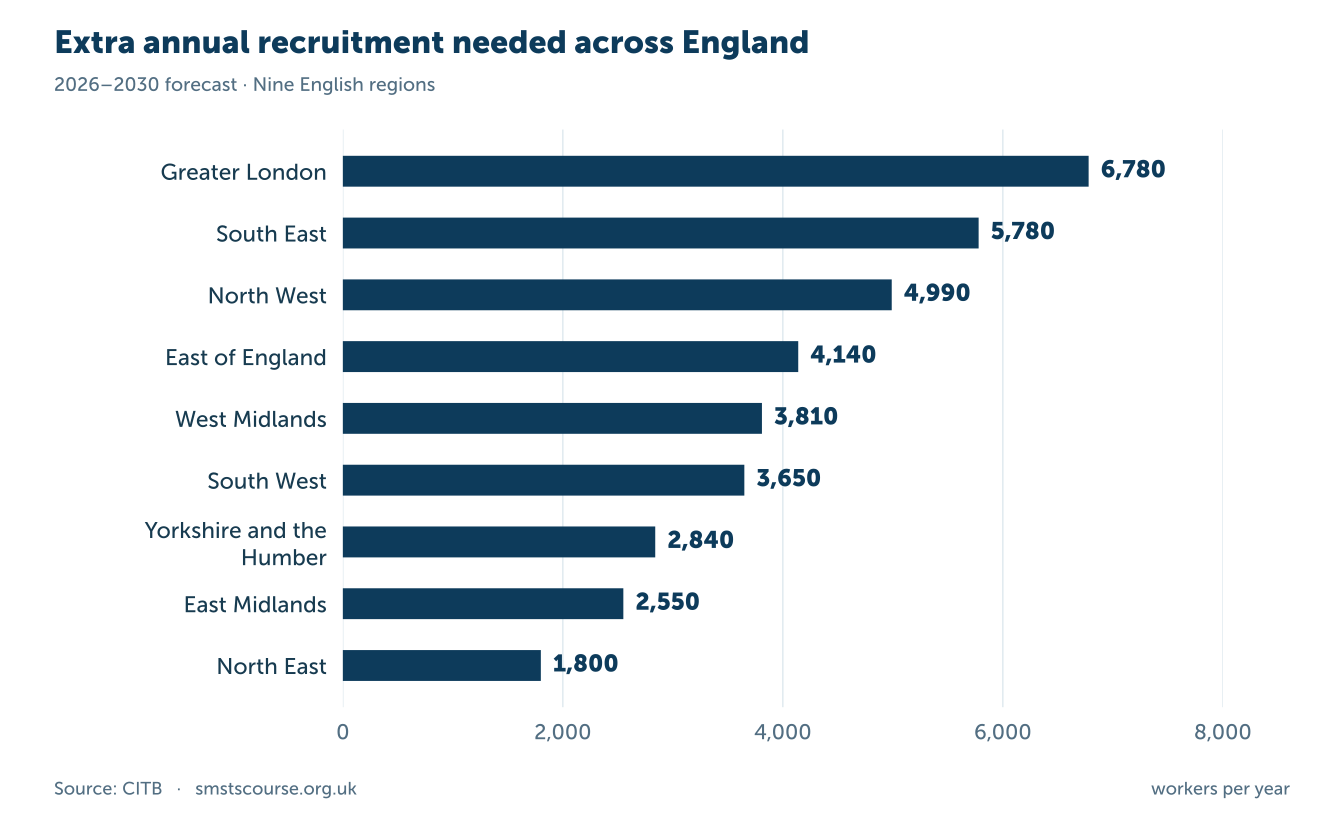
Annual extra recruitment required above recent flows. Raw totals reflect region size; accompanying table also shows percentage of each regional workforce.
The chart compares non-overlapping areas: nine English regions plus Scotland, Wales and Northern Ireland. It does not add the England total to its regions. Percentages use the same forecast period and each area’s own 2025 workforce; they are not vacancy rates or direct measures of how difficult an individual employer will find recruitment.
A housebuilding contractor and an infrastructure contractor in the same place may need different occupations at different times. Use the forecast to investigate your project programme, subcontractor availability and training capacity. Pay and retention also matter: our site manager salary guide explains the limits of comparing local pay, while our women in construction statistics examine another part of the recruitment pipeline.
Why do some forecasts say construction needs more than one million workers?
Skills England’s October 2026 assessment models a longer period and a different question: the demand associated with delivering government commitments across 30 priority construction occupations. It estimates 493,000 additional workers between 2025 and 2035, plus 595,000 replacements over 2026–2035, giving combined demand of 1,088,000. Skills England, sections 2 and 5 [6].
| Component | Workers | Period |
|---|---|---|
| Expansion demand | 493,000 | 2025–2035 |
| Replacement demand | 595,000 | 2026–2035 |
| Combined demand | 1,088,000 | To 2035 |
The assessment is conditional on delivery of housing and infrastructure ambitions, including England’s housebuilding target. Skills England describes the projections as indicative, with substantial uncertainty. It also identifies overlap with other sectors: 19 of the 30 occupations are priorities elsewhere, including 17 shared with clean energy. Skills England handling notes and occupation analysis [6].
It would be wrong to add this million-plus figure to CITB’s five-year forecast. The two exercises use different time horizons, occupation coverage and assumptions. Neither establishes that a million construction vacancies exist today.
Are enough people entering construction apprenticeships?
The latest England figures show 23,900 starts in Construction, Planning and the Built Environment during August 2025–April 2026, an increase of 5% against the equivalent previous-year period. These are provisional figures for three academic quarters. Full-year 2025/26 results were still awaiting publication at our review date. DfE, July 2026 release [5].
Completion matters alongside recruitment. The official 2024/25 achievement rate was 58.3% for this construction subject area, compared with 65.4% across all apprenticeship subjects. Achievement rates use the qualification-achievement methodology; they are not calculated by dividing one calendar year’s achievements by its starts. DfE national achievement rate tables [5].
These figures are about subjects studied in England. They do not capture every apprenticeship offered by a construction employer: businesses also recruit apprentices in engineering, business and other subjects. Equally, starting a programme does not mean a learner has already joined the fully competent workforce.
For a broader geographic view, CITB reports approximately 33,000 construction apprenticeship starts across Great Britain in 2024/25 and says 17% of construction businesses currently employ an apprentice. The different coverage means that total should not be treated as a direct revision of the England subject-area count. CITB apprenticeship research summary [7].
Employer support is another part of the picture. CITB’s New Entrant Support Team supported 5,913 apprenticeship starts in the 2025/26 financial year. That is a programme activity measure, not an extra pool to add to national apprenticeship totals. CITB NEST results [8].
The useful question is therefore how many learners progress into sustained, skilled employment. Comparing apprenticeship starts with CITB’s recruitment requirement by subtraction would miss existing workers changing roles, returning workers, other education routes and differences in geography.
What the figures mean for site management and training
For a site manager, skills planning needs to connect the project programme with the people available to deliver it. Check which roles depend on a single experienced worker, when apprentices will need supervision and which forthcoming activities require specialist competence. A national recruitment forecast can justify planning ahead, but the decisions still need to reflect the actual work.
Training also has different purposes. An apprenticeship develops occupational competence over time; management safety training develops knowledge for supervising and managing work safely. Current and aspiring site managers can explore the CITB SMSTS course for health, safety and environmental responsibilities. It forms one part of professional development alongside relevant experience and role-specific competence.
Frequently asked questions
Is the UK construction skills shortage getting worse?
The answer depends on the measure and period. Current vacancies have fallen, while employer surveys still record difficulty obtaining skilled people and forecasts indicate substantial future recruitment needs. It is more accurate to report those trends separately than to describe every indicator as moving in the same direction.
Does a skills shortage guarantee a construction job?
No. Employers need particular combinations of occupation, experience, competence, location and availability. An industry-wide forecast cannot guarantee a vacancy for an individual applicant or a specific salary.
Is the shortage only about bricklayers and other trades?
No. The occupation table includes construction project managers, supervisors, surveyors and civil engineers as well as trades. That makes management development and succession planning relevant alongside recruitment into practical occupations.
Does the 206,000 figure mean 206,000 new jobs?
No. It represents extra recruitment over the five-year forecast period. Recruitment is needed both to support workforce growth and to replace departures. The net increase in the workforce is a different measure.
Can apprenticeship starts be used to calculate the remaining shortfall?
Not by simple subtraction. Starts measure entry into training, use different geographic and subject definitions, and exclude other recruitment routes. Completion and subsequent employment must also be considered.
Sources and methodology
This page was reviewed on 11 November 2026 using official statistics, primary workforce research and a clearly identified industry survey. We checked CITB’s occupation and regional PDF tables and downloaded the October 2026 ONS VACS02 workbook to verify the construction series. Charts reproduce those published figures; they are not a new survey or a proprietary shortage index.
Dates refer to the period measured, which can differ from publication. UK, Great Britain and England figures remain labelled separately. Vacancy counts are seasonally adjusted three-month averages. Forecast recruitment is shown as an annual average; five-year totals are labelled accordingly. Percentages of vacancies, workers and businesses use different denominators.
Published rounding is retained. The ONS quarterly percentage change uses its unrounded calculation, so it may differ slightly from a calculation using the rounded counts in our table. Survey percentages can overlap. Apprentice subject classifications and provisional statistics can be revised, so comparisons should use the same release and definitions.
For citations, use the relevant source link beside each statistic and include its reporting period. Readers checking live conditions after this review date should consult the latest release from the source publisher.