
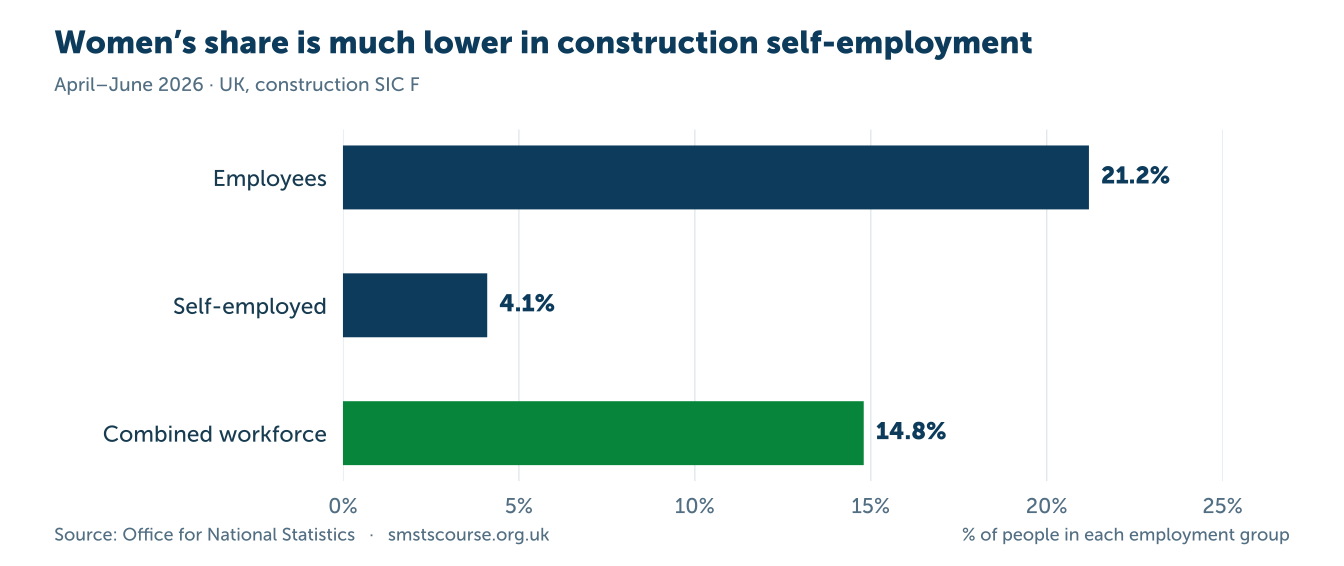
Women accounted for 14.8% of UK construction employment in April–June 2026: approximately 306,000 women among 2.06 million employees and self-employed people. Female representation differs substantially between employment groups, occupations and training routes. In England, women accounted for 9.8% of construction apprenticeship starts in the latest academic year with final published data, 2024/25. Sources: ONS EMP14 [1] and DfE apprenticeship subject tables [2].
This reference page brings together workforce, apprenticeship, occupational and pay statistics. Each table identifies the period and population covered so that a UK workforce estimate is not confused with an English training figure or a survey of one part of the industry. Data checked on .
On this page
- About these figures
- Key women in construction statistics
- How many women work in UK construction?
- Women in engineering construction: trades and management
- Female construction apprenticeships in England
- Which English regions have the highest female apprenticeship share?
- What is the gender pay gap in construction?
- What do women report about progression and workplace experience?
- Frequently asked questions
- Calculations and update method
- Download the data
- Sources
Key women in construction statistics
- 14.8% of UK construction employees and self-employed people were women in April–June 2026.[1]
- 21.2% of construction employees were women, compared with 4.1% of its self-employed workforce. [1]
- 2,410 female apprenticeship starts were recorded in construction, planning and the built environment in England in 2024/25, equivalent to 9.8% of starts. DfE [2]
- 10.6% of starts in that subject area were female in August 2025–April 2026. This is provisional data for three quarters. DfE [2]
- 10.3% was the median hourly gender pay gap among full-time UK construction employees in April 2026. ONS ASHE [3]
How many women work in UK construction?
The latest available ONS EMP14 release at the time of checking was published on 18 August 2026 and covers April–June 2026. Adding its female employee and self-employed estimates gives 305,850 women in construction. The equivalent combined total for women and men is 2,060,284 people. These are survey estimates: the rounded description, “about 306,000 women”, is more appropriate than treating the underlying figure as an exact headcount. [1]
| Employment group | Women | All workers | Women’s share |
|---|---|---|---|
| Employees | 274,231 | 1,292,315 | 21.2% |
| Self-employed | 31,619 | 767,969 | 4.1% |
| Combined | 305,850 | 2,060,284 | 14.8% |
There is a large difference between employees and people working for themselves. Women make up roughly one in five construction employees but around one in twenty-four self-employed construction workers. About 89.7% of the women in this combined construction estimate are employees, calculated as 274,231 divided by 305,850. This describes employment status; it does not tell us whether someone works on site, in an office or in both settings. Source and calculation inputs: ONS [1].
Scroll horizontally to view the full chart on a small screen.
Has female representation increased?
The same-quarter comparison below provides context without mixing seasonal periods. Women’s share was about 12.0% in April–June 2016 and 14.8% in April–June 2026. It has not risen smoothly every year. Both the number of women and the size of the overall construction workforce affect the percentage.[1]
| Quarter | Women in construction | Total construction employment | Women’s share |
|---|---|---|---|
| April–June 2016 | 275,000 | 2,301,000 | 12.0% |
| April–June 2021 | 311,000 | 2,109,000 | 14.7% |
| April–June 2025 | 311,000 | 2,064,000 | 15.1% |
| April–June 2026 | 306,000 | 2,060,000 | 14.8% |
ONS advises caution over short-term Labour Force Survey movements. Changes to sampling and data collection affect recent estimates, and volatility is particularly relevant to smaller groups. A change between two quarters should therefore not be presented as proof that a recruitment campaign has succeeded or failed. The figures above are not seasonally adjusted. ONS release notes [1].
Women in engineering construction: trades and management
An industry total includes every occupation within businesses classified as construction. A receptionist, a quantity surveyor and a tradesperson can all be part of that total. An occupational statistic instead selects people by the work they do. A statistic about people physically working on sites requires another definition again. These measures answer different questions.
The 2024 ECITB workforce census provides a useful occupational comparison for engineering construction in Great Britain and in-scope offshore work. Women accounted for 16.9% of the recorded workforce, up from 13.8% in 2021. Gender information covered 57,966 workers, or 77.7% of the census database. This is a specialist industry population, not a replacement for the UK construction estimate.[4]
| Occupation or group | Women’s share |
|---|---|
| Scaffolders | 0.1% |
| Engineers | 14.1% |
| Directors | 16.8% |
| Entire engineering construction census | 16.9% |
| Administration | 83.8% |
| Human resources | 87.2% |
Scroll horizontally to view the full chart on a small screen.
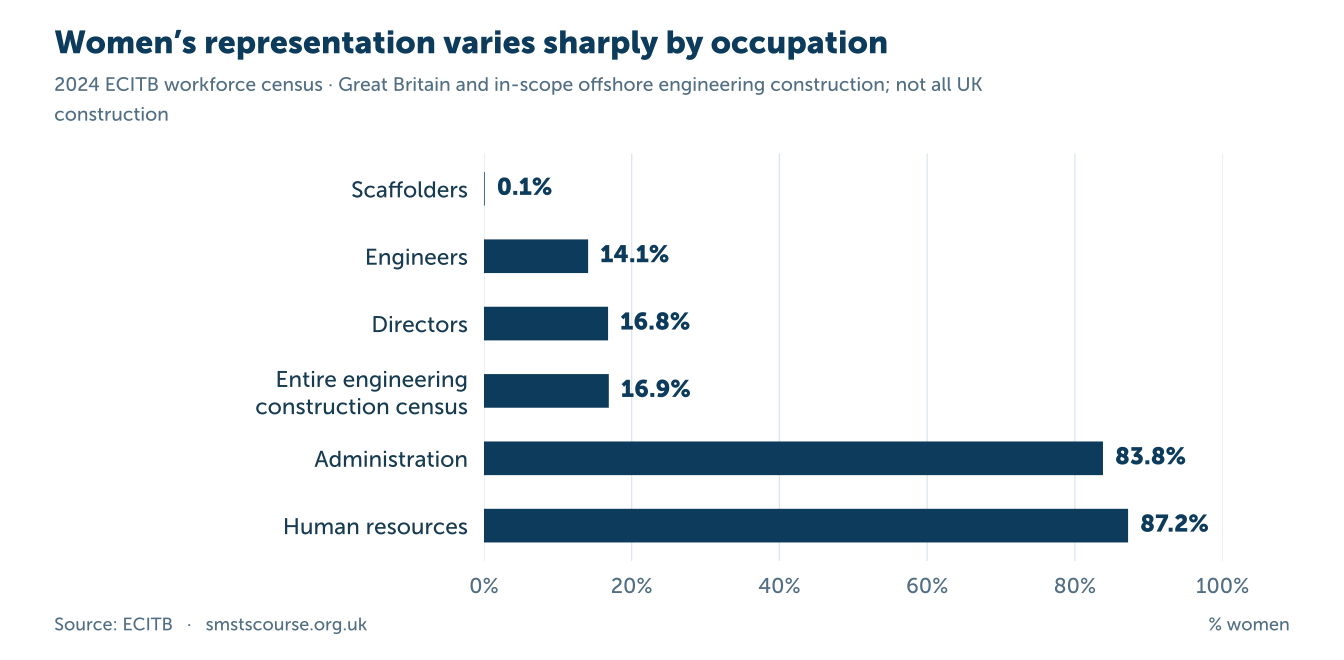
Within this census, female representation among directors was close to the overall engineering construction share, while the occupational differences were much larger. The scaffolding result applies to the census’s scaffolding workforce. It should not be relabelled as the percentage of women on all UK construction sites.[4]
Why there is no single “women on site” percentage here
“On site” may mean manual trades, everyone deployed to a project, or people whose normal workplace is a construction site. It can include managers, engineers and safety professionals as well as craft workers. Without a dated source and a stated denominator, a low headline percentage is difficult to check or compare. For a recruitment or inclusion programme, occupation-specific results are more useful than an undefined site-wide claim.
Female construction apprenticeships in England
In the latest final full-year series, women started 2,410 apprenticeships in construction, planning and the built environment during 2024/25, out of 24,470 starts. Their share was approximately 9.8%. The current, consistently classified series shows female starts rising from 1,310 in 2020/21 to 2,410 in 2024/25, an increase of approximately 84.0%.[2]
| Academic year | Female starts | All starts | Female share |
|---|---|---|---|
| 2020/21 | 1,310 | 20,210 | 6.5% |
| 2021/22 | 1,750 | 26,470 | 6.6% |
| 2022/23 | 2,060 | 24,470 | 8.4% |
| 2023/24 | 2,210 | 24,340 | 9.1% |
| 2024/25 | 2,410 | 24,470 | 9.8% |
Scroll horizontally to view the full chart on a small screen.
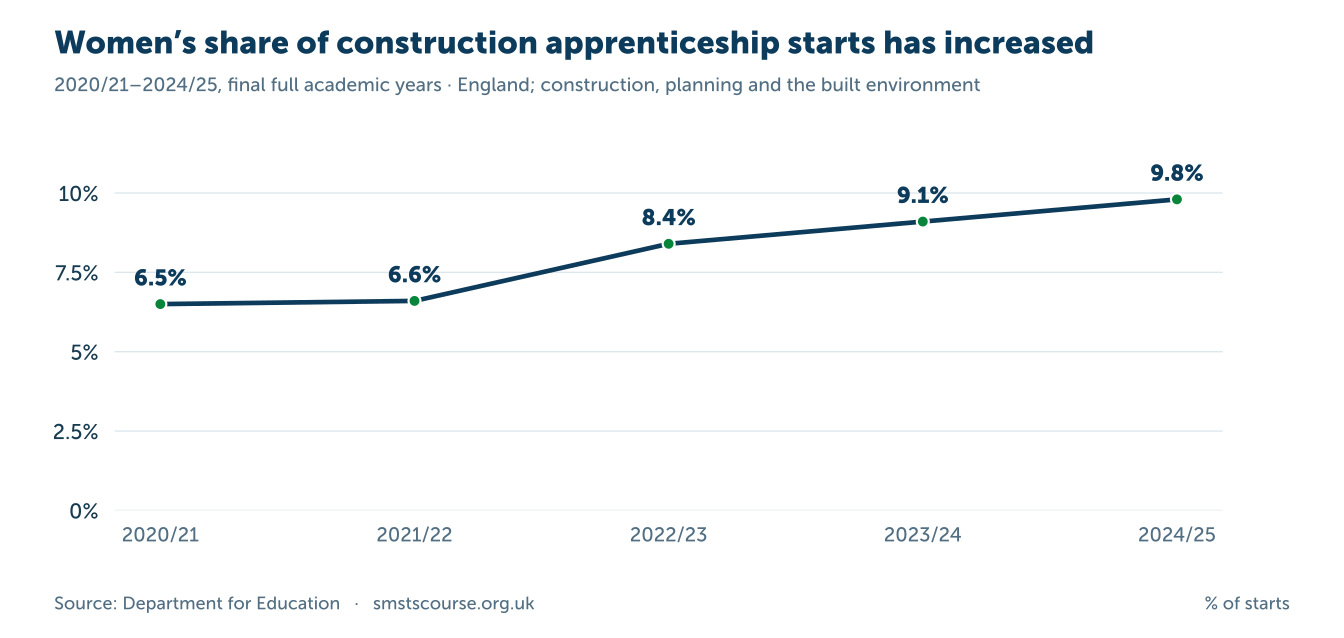
This subject area includes planning and the built environment as well as construction. It should not be described as a count of female trade apprentices alone. Across all apprenticeship subject areas, women accounted for approximately 52.5% of starts in 2024/25: 185,500 of 353,500. The comparison shows how different the construction training pipeline is from apprenticeships overall.[2]
What do the latest provisional figures show?
For August 2025 to April 2026, the published construction subject-area totals are 2,540 female starts out of 23,900 starts, or 10.6%. These figures cover the first three quarters of 2025/26 and remain provisional. They are shown separately from the full-year trend because comparing nine months with twelve months would give a misleading growth rate.[2]
The latest release states that the full and final 2025/26 academic-year figures will be published in November 2026. Until that release is available, 2024/25 remains the latest completed year in this page’s trend table.[2]
Why some older pages show different apprenticeship numbers
The government changed the sector subject-area classifications for apprenticeship standards and recast earlier years to produce a consistent series. This page uses that revised series throughout. Combining an older classification for one year with a revised classification for another can create an apparent increase or decrease that partly reflects standards moving between categories.[2]
Which English regions have the highest female apprenticeship share?
In the latest provisional period, London had the highest female share of construction, planning and the built environment starts among England’s nine regions: 18.0%. The East of England followed at 12.3%. The East Midlands had the lowest share, 8.6%. These are shares within each region, rather than each region’s contribution to the national total.[2]
| Learner’s region | Female starts | All starts | Female share |
|---|---|---|---|
| London | 380 | 2,110 | 18.0% |
| East of England | 320 | 2,600 | 12.3% |
| South East | 370 | 3,250 | 11.4% |
| West Midlands | 210 | 2,080 | 10.1% |
| Yorkshire and The Humber | 260 | 2,750 | 9.5% |
| North East | 170 | 1,860 | 9.1% |
| North West | 340 | 3,750 | 9.1% |
| South West | 280 | 3,130 | 8.9% |
| East Midlands | 180 | 2,100 | 8.6% |
Scroll horizontally to view the full chart on a small screen.
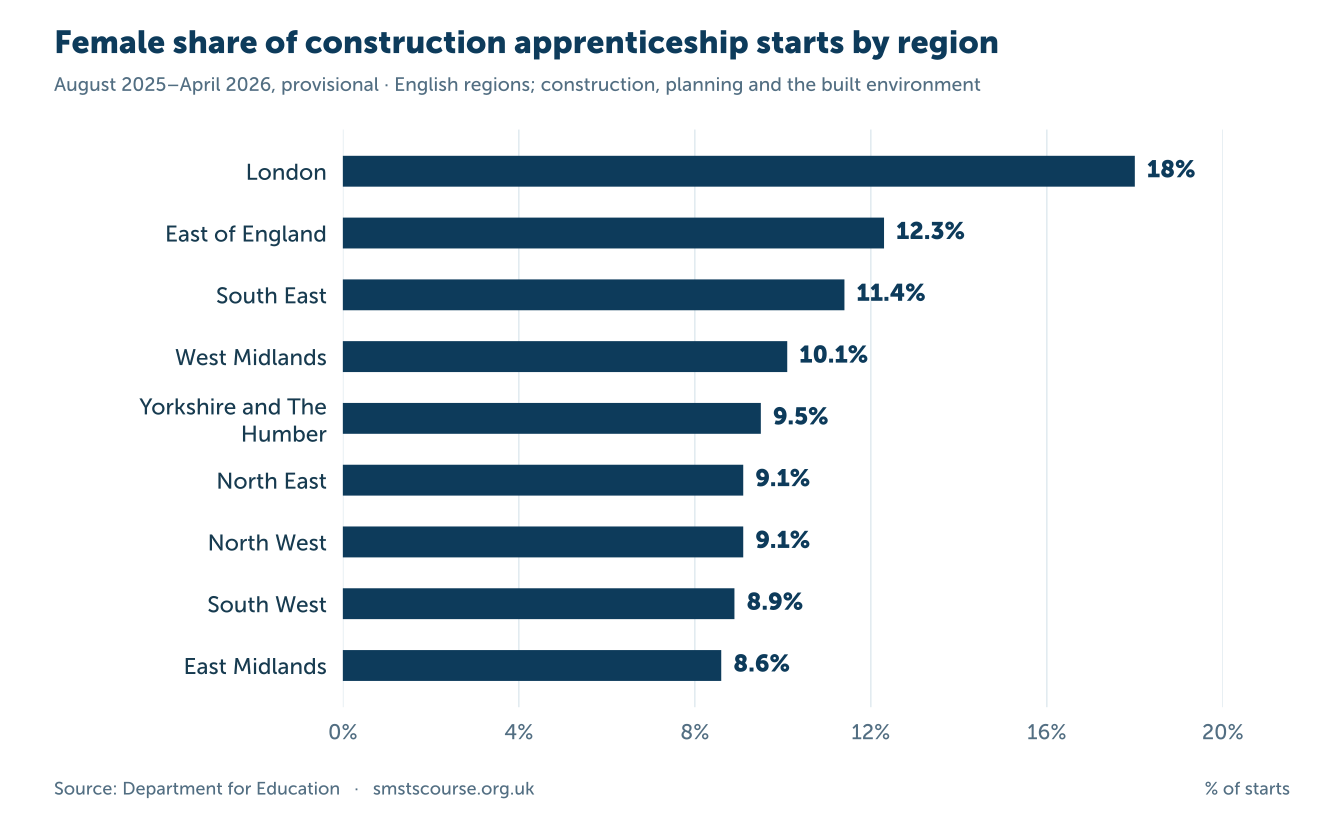
The regional breakdown uses learners’ home locations, following the official apprenticeship geography definition [2]. A learner’s region should not be treated as the location of their employer or every project they work on. The underlying file also has an “outside England and unknown” group, which is retained in our downloadable data but excluded from the nine-region comparison. Published counts are rounded, so regional values may not add exactly to the England total.[2]
A regional percentage does not by itself explain employer practice. Differences in the mix of apprenticeship standards, levels and local industries may affect the result. An employer evaluating its own recruitment should compare the roles it offers and the applicants it reaches, alongside the regional headline.
What is the gender pay gap in construction?
The median hourly gender pay gap for full-time construction employees was 10.3% in April 2026. The corresponding figure across all industries and services was 6.8%. Including both full-time and part-time construction employees gives a gap of 16.1%. These are the ONS’s updated provisional 2026 estimates.[3]
| Industry | Full-time median gap | All-employee median gap |
|---|---|---|
| Construction overall | 10.3% | 16.1% |
| Construction of buildings | 12.6% | 15.3% |
| Civil engineering | 11.6% | 16.3% |
| Specialised construction activities | 14.1% | 17.9% |
| All industries and services | 6.8% | 12.3% |
Scroll horizontally to view the full chart on a small screen.
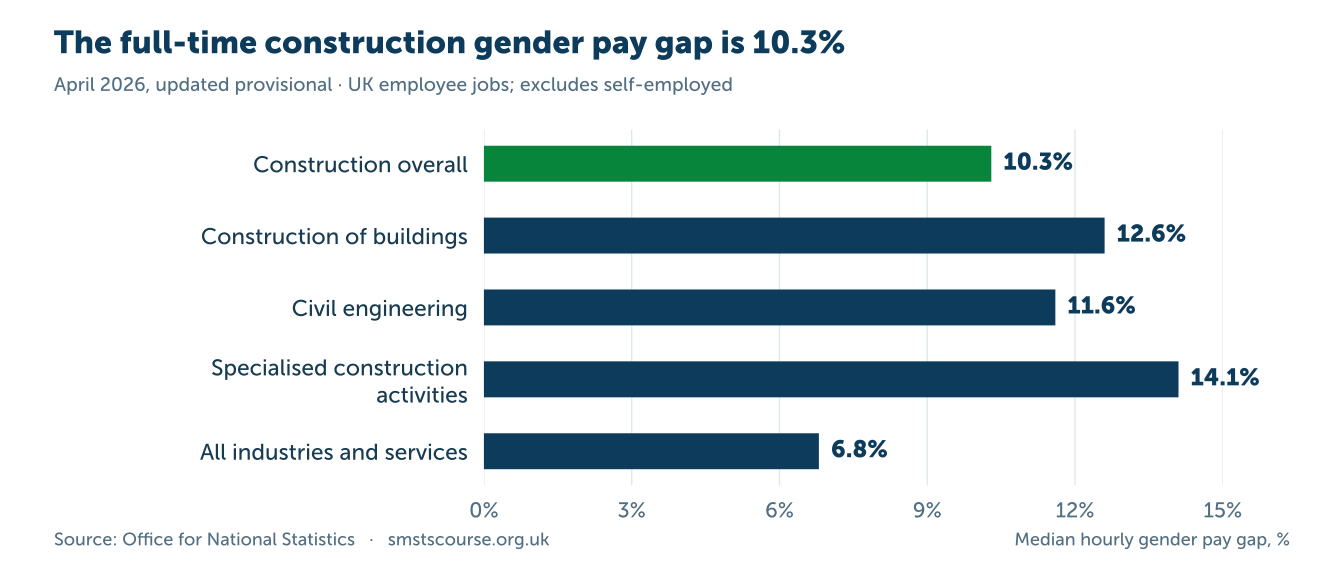
The gap measures the difference between men’s and women’s median hourly earnings, excluding overtime, as a percentage of men’s earnings. A 10.3% gap means that the female median hourly figure was 89.7% of the male median for that group. It does not mean every woman earned 10.3% less than a man doing the same job.[3]
Industry-wide comparisons combine different occupations, seniority levels, employers and working patterns. They describe the distribution of earnings rather than an adjusted comparison of otherwise identical workers. The all-employee and full-time figures are therefore both useful, but they answer different questions. Neither includes self-employed workers.[3]
ONS rates the civil engineering median estimates in the table as reasonably precise; the other industry rows shown are rated precise. All 2026 figures remain provisional. The overall construction median gap is calculated from the underlying employee distribution, so it is not the simple average of the three subsector gaps.[3]
What do women report about progression and workplace experience?
Workforce percentages cannot explain why someone joins, stays or leaves. Holcim UK’s 2026 internal survey offers one company-level perspective. It received responses from 216 women; 28.9% were in operational roles and 71.1% in support functions. It is not a representative national construction survey.[5]
| Reported challenge | Respondents |
|---|---|
| Lack of visibility of senior roles and grading | 46% |
| Career progression | 37.4% |
| Personal skills challenges, including confidence | 36.4% |
| Work-life balance | 35.9% |
In the same survey, 39.2% reported experiencing or witnessing gender bias or inequality at work, while 59.2% identified supportive colleagues as a strength. These findings describe respondents’ experiences within Holcim UK. They should not be presented as prevalence estimates for all construction workers.[5]
For a site management team, the practical questions are specific: are development opportunities visible, are expectations for promotion clear, and can workers raise concerns? Tracking applications, appointments, training opportunities and retention by role can help an employer see where representation changes within its own workforce. These are suggested measures for evaluation, not outcomes established by the national statistics.
Frequently asked questions
What percentage of UK construction workers are women?
Approximately 14.8% in April–June 2026, based on ONS employees plus self-employed estimates for the construction industry. That is about 306,000 women. The figure covers the industry’s full mix of occupations.[1]
Are the apprenticeship figures UK-wide?
No. The apprenticeship statistics used here cover England. They do not provide a combined UK total for Scotland, Wales and Northern Ireland. The 2024/25 figures are final full-year totals; the 2025/26 figures cover August to April and are provisional.[2]
Do apprenticeship starts count individual women?
Starts count programmes begun during the period. A person who starts more than one programme can appear more than once. Starts are also different from the number of apprentices actively participating or completing in the year.[2]
Does a construction gender pay gap measure unequal pay for the same job?
No. It compares group earnings and does not control for differences such as occupation or seniority. It is useful for understanding an industry’s pay distribution, but it is not a like-for-like pay audit.[3]
Can the occupational figures be used as an all-construction benchmark?
The ECITB figures apply to engineering construction within its census scope. Use them as a clearly labelled occupational example, not an estimate for every construction business.[4]
For the wider hiring picture, our construction skills shortage statistics cover recruitment needs across all four UK nations. Our site manager salary guide separates advertised pay from official employee earnings.
Calculations and update method
This compilation prioritises official statistics and original research. Percentages calculated for this page divide the female count by the matching total and multiply by 100. Most results are displayed to one decimal place. Apprenticeship counts are published rounded to the nearest ten, so percentages calculated from those counts are approximate. See the government’s rounding guidance [2]. Raw published counts and calculation inputs are retained in the downloadable dataset; apparent precision in the inputs should not be mistaken for an exact census of the UK workforce.
- Workforce: ONS Labour Force Survey, EMP14, release 18 August 2026. Construction is SIC 2007 section F. We add employees and self-employed people and compare April–June observations. These figures count people; other publications may count jobs or use a broader built-environment definition. [1]
- Apprenticeships: government 2025/26 release, updated 16 July 2026. We use the recast subject-area series and distinguish final full-year results from provisional year-to-date results. Starts and achievements are different cohorts, so dividing one by the other would not produce a valid completion rate. [2]
- Pay: ONS ASHE 2026 updated provisional gender pay gap tables, released 27 October 2026. Median hourly figures exclude overtime and cover employee jobs rather than the self-employed. [3]
- Occupations and experience: the ECITB census and Holcim survey retain their original population boundaries. Neither is presented as a census or representative survey of all UK construction workers. ECITB report [4]; Holcim survey [5]
When updating this page, replace a complete comparable series where the publisher revises it, retain the reference period beside every figure, and recheck any derived percentages. A newer publication date does not necessarily mean that every table describes a newer measurement period.